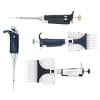
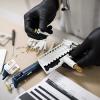
Different researchers in numerous labs may use a multitude of methods to prepare samples, extract RNA, perform reverse transcription, and run controls. Of note, qPCR is especially sensitive to variations in pipetting technique and pipetting errors. As a result, each assay could yield a different result. These variations are difficult to record accurately, making it hard to trace their source and to adjust the workflow to improve reproducibility with future iterations.
To make the qPCR technique more reproducible, scientists need liquid handling protocols that can be readily automated, modified, and transferred between different instruments without affecting the quality of the data itself.
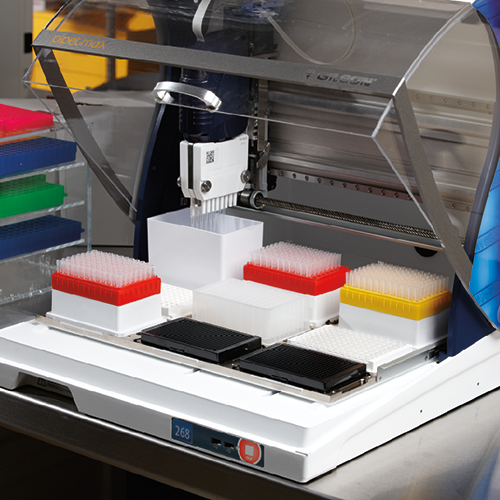
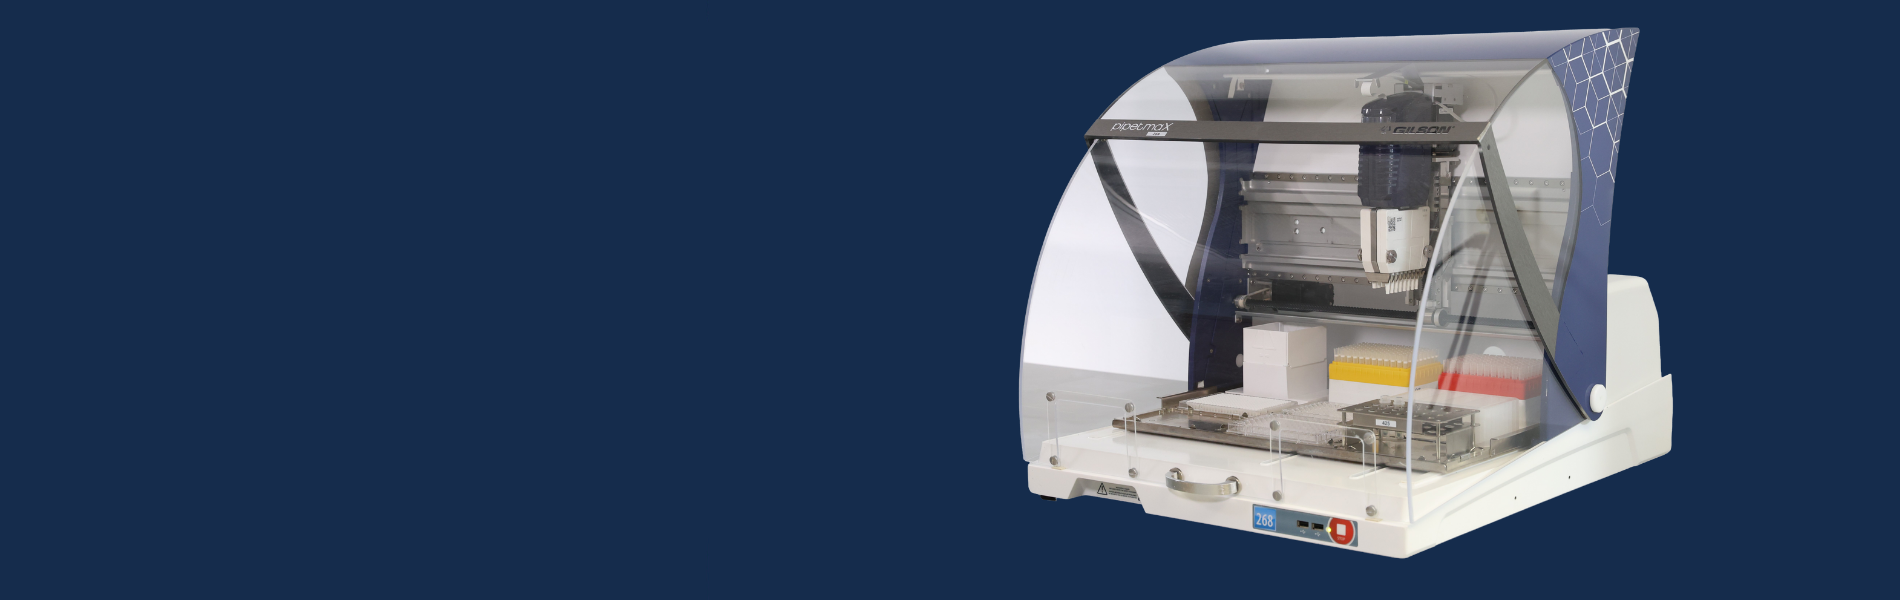
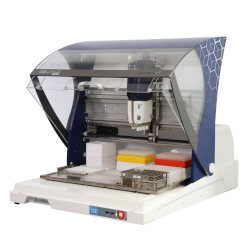
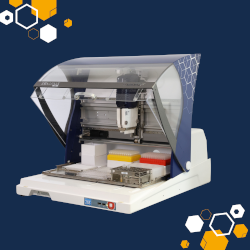
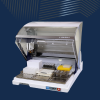
To help researchers, Synthacehas developed Antha, a cloud-based software platform that allows users to create, edit, and control their automated liquid handling methods using an intuitive drag-and-drop visual interface. Applied to liquid handlers such as PIPETMAX® 268, Microlab® STAR™, and Freedom EVO® 100, the software preserves accuracy, even in low-volume liquid handling techniques, minimizing human error and improving reproducibility and sample tracing.
Why Pay More for the Same Results?
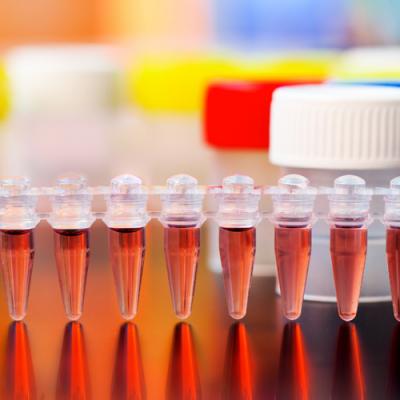
In a recent study, Synthace used its Antha software to generate equivalent qPCR results using PIPETMAX® 268, Microlab® STAR™, and Freedom EVO® 100. The team ran a generic, two-phase qPCR protocol: 1. serially diluting the DNA template to generate a standard curve and calculate primer efficiency, and 2. combining the templates and master mix in replicates, in preparation for qPCR. The reactions prepared by different liquid handlers were set up on the same plate to aid the comparison.
THE COMPARISON OUTCOME
Interestingly, the PIPETMAX® 268, at a price point two to three times lower than the other liquid handlers, ran the same protocol and yielded the same results, and was more than 25 percent faster (Figure 1). With its more compact footprint, PIPETMAX® 268 provides researchers with the very best liquid handling platform at a more affordable price.
The primary aim of the study was to use Antha to easily transfer and execute the same qPCR protocol on different liquid handlers and test the reproducibility of results. This would be achieved by performing a serial dilution of the DNA template and observing a primer efficiency of 90-105%, the benchmark efficiency in a validated qPCR assay. This process allows researchers to calculate the slope of the cycle quantification (Cq) value in relation to the DNA concentration curve. This is integral to the qPCR technique, as it determines the relative quantification of the DNA template. To get an accurate reading, the two phases of the serial dilution must be performed impeccably. The first element is the accurate transfer of the DNA and diluent; the second key step is sufficiently mixing the solution between dilution steps.
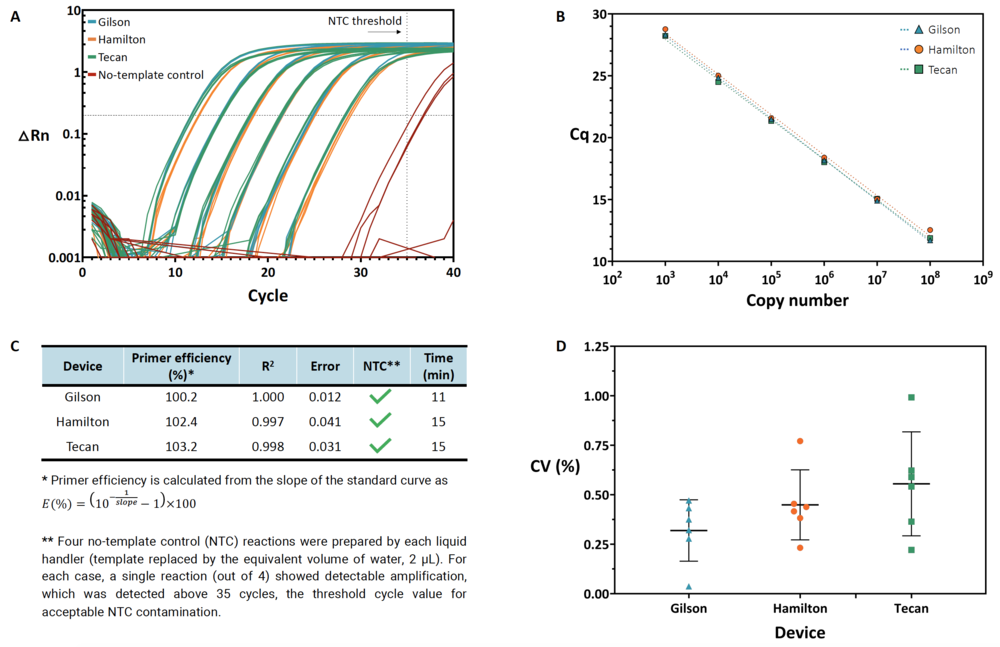
Using the automation software, the researchers were able to perform six 10-fold dilutions of the DNA template. Their goal was to transfer the same qPCR protocol between three devices and reproducibly achieve primer efficiencies of 90-105%, the hallmark of a validated qPCR assay. Further, the dilution yielded comparable Cqvalues and a coefficient of variation ?1% across all of the technical replicates for the various DNA concentrations. Finally, among the control reactions, where there was no template DNA; the researchers did not find any significant contamination. See Figure 1 for more details.
Figure 1: Anthaprepared a standard curve using six dilutions and four technical replicates per dilution with PIPETMAX® 268 and two other liquid handlers on the same 384-well plate. The program yielded consistent results across all three platforms. (A) Amplification curves showing the normalized reporter signal (?Rn) versus the cycle number, including no-template control reactions (red). (B) Quantification cycle (Cq) versus plasmid copy number (symbols) and the associated linear regression (dashed lines). Error bars represent the standard deviation of the mean. (C) Primer efficiency and associated linear regression metrics (R2 and standard error of the slope in the regression), no-template controls (NTCs), and execution time. (D) Coefficient of variation (CV, %) for each set of technical replicate reactions. Triangles/circles/squares correspond to observed CV values, horizontal lines show the mean, and error bars represent standard deviation. The team found no significant differences among the distributions of CVs across all three devices (one-way ANOVA, p = 0.1672). From Synthace.